
Amount of Information Processed in One Day
July 24, 2025
Amount of Information Processed in One Day (up to 2025)
The human brain encounters an enormous volume of information every day. The following overview shows how the average person’s daily information consumption has evolved up to 2025 across several dimensions. We look at the digital data volume (measured in gigabytes), the types of information (textual, visual, audio), the media categories (e.g. social media, e-mail, television, radio, online articles), the devices used (smartphone, computer, TV) and specific platforms (TikTok, YouTube, Facebook, Netflix, etc.). Finally, we present the information flood at individual, national and global level.
Digital data volume per day (in GB)
Even decades ago, the amount of information a single person processed daily was staggering, and it has grown exponentially since. A U.S. study published in 2009 found that in 2008 an average individual received about 34 GB of information per day. That figure covered all sources (TV, radio, newspapers, internet, etc.) and corresponded to roughly 105,000 words during waking hours—or 23 words per second. When images, videos and games were added, the total reached 34 GB. To put that in perspective, one week of such data would overload a typical laptop’s storage. Note that these values describe the estimated digital equivalent of sensory input, not actual downloads.
Information inflation
The pace of “information inflation” is dramatic. In the 1970s the daily load was roughly a quarter of today’s; by 2008 it had grown 4.5-fold. The trend continued: U.S. averages hit 63 GB/day by 2012 and exceeded 75 GB/day by 2015. The compiled chart was produced with GPT-o3-pro deep-research data, validated against Gemini 2.5 Pro on 2025-06-05.
No unified 2025 GB figure exists yet, but digital interactions tell the story: from ~298 daily digital touches in 2010 to an expected 4,909 in 2025—a 16-fold rise, implying a huge jump in data processed.
Globally, humanity generated ≈402.7 million TB of new data every day in 2024 (~0.4 zettabytes), or 147 ZB per year. Average internet traffic was 33 EB/day, meaning ~4.2 GB of network data per user—lower than the 75+ GB sensory estimate because the latter counts the visual information content, not just transferred bytes.
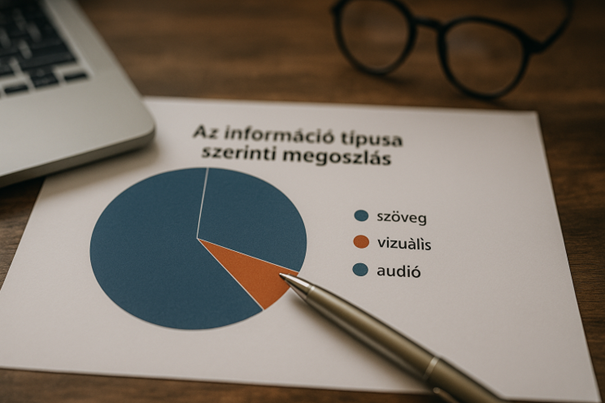
Breakdown by information type (text • visual • audio)
- Textual: Roughly 105,000 words reach the average person daily via speech, reading, captions, etc.—equivalent to 200–300 printed pages.
- Visual: Video and imagery dominate data volume. One hour of HD video can equal several GB. Streaming’s rise (YouTube, Netflix, TikTok) has further increased the share of visual data; the average user watched 4.5 h of online video daily in 2024.
- Audio: Radio, music, podcasts and calls remain significant. In Hungary, adults listened to ≈152 min of radio per day in 2022. Audio is less data-heavy than video but still a major cognitive load.
Breakdown by media channel
| Medium | Typical daily exposure | Notes |
|---|---|---|
| Television / Streaming | HU avg ≈ 5 h (2022) | Live TV still large; streaming shifting habits |
| Internet incl. Social | HU avg ≈ 3–3.5 h | Global social-media mean ≈ 143 min |
| Hundreds of mails/day in office roles | 362 billion emails sent daily worldwide | |
| Radio / Music / Podcasts | HU radio ≈ 2.5 h | Podcast listening rising |
| Print press & books | HU print ≈ 17 min | Much news consumption moved online |
Breakdown by device
- Smartphone: Now the primary information hub—global average screen-time >5 h/day; total internet screen-time 6 h 38 m.
- PC / Laptop: Still crucial for work and study (~3–4 h/day in the U.S.).
- TV set: Dominates long-form, passive viewing; Netflix users watched ≈1 h 46 m/day in 2024.
People often use multiple screens simultaneously, so times overlap rather than add.
Breakdown by platform
| Platform | Average daily time | Key role |
|---|---|---|
| TikTok | ≈ 95 min | Short-form, highly visual |
| YouTube | ≈ 47–50 min | Mixed long & short video |
| ≈ 30 min | Text-centric social updates | |
| ≈ 62 min | Visual stories & reels | |
| X / Twitter | ≈ 30 min | Real-time text & news |
| Snapchat | ≈ 19 min | Visual messaging (youth) |
| Netflix | ≈ 106 min | Long-form streaming |
Daily information load at different scales
Individual level
Today, a technologically advanced individual may approach ≈100 GB/day of sensory-equivalent data (exact 2025 figure pending). Media exposure occupies ~11–12 h, comprising thousands of words, images and videos—hence the modern “information overload” phenomenon.
National example – Hungary
NMHH data (2022) shows Hungarian adults consume ≈11 h of media daily: 5 h TV, 3–3.5 h internet, 2.5 h radio, 17 min print. Household media spend averaged ~18 140 HUF/month.
National example – United States
U.S. adults topped 12 h of media use in 2022—~4 h TV and 6–7 h internet. Average household internet traffic ~650–700 GB/month (≈20–23 GB/day), implying 50–100 GB of total sensory information per person when non-internet media are included.
Global level
Humanity created ≈0.4 ZB of new data daily in 2024. With 5.3 billion internet users spending 6 h 38 m online, people collectively devote 14 billion user-hours per day to social media—about 1.6 million years of human attention every 24 h.
Conclusion
By 2025, both data generation and consumption eclipse all prior levels. Annual data creation nears 150 ZB and may reach 180–200 ZB by 2028. The benefits—instant access to knowledge and entertainment—come with challenges: divided attention, misinformation and cognitive overload. In short, we now encounter more information per day than earlier generations did in months or years, and the curve is still climbing.
References
Full list of references available in the original document, including sources such as UC San Diego, NMHH, Statista, DataReportal, Backlinko, ElectroIQ, Exploding Topics, and others.
Author:
Sándor Salamon, IT Team Lead